Type of data and Measurement Scale
Data is a valuable asset – so much so that it’s the world’s most valuable resource. That makes understanding the different types of data – and the role of a data scientist – more important than ever. In the business world, more companies are trying to understand big numbers and what they can do with them. Expertise in data is in high demand. Determining the right data and measurement scales enables companies to organise, identify, analyse and ultimately use data to inform strategies that will allow them to make a genuine impact.
What is data? In short, it’s a collection of measurements or observations, divided into two different types: qualitative and quantitative.
Qualitative data refers to information about qualities, or information that cannot be measured. It’s usually descriptive and textual. Examples include someone’s eye colour or the type of car they drive. In surveys, it’s often used to categorise ‘yes’ or ‘no’ answers.
Quantitative data is numerical. It’s used to define information that can be counted. Some examples of quantitative data include distance, speed, height, length and weight. It’s easy to remember the difference between qualitative and quantitative data, as one refers to qualities and the other refers to quantities.
A bookshelf, for example, may have 100 books on its shelves and be 100 centimetres tall. These are quantitative data points. The colour of the bookshelf – red – is a qualitative data point.
Quantitative, or numerical, data can be broken down into two types: discrete and continuous.
Discrete data is a whole number that can’t be divided or broken into individual parts, fractions or decimals. Examples of discrete data include the number of pets someone has – one can have two dogs but not two-and-a-half dogs. The number of wins someone’s favourite team gets is also a form of discrete data because a team can’t have a half win – it’s either a win, a loss, or a draw.
Continuous data describes values that can be broken down into different parts, units, fractions and decimals. Continuous data points, such as height and weight, can be measured. Time can also be broken down – by half a second or half an hour. Temperature is another example of continuous data.
There’s an easy way to remember the difference between the two types of quantitative data: data is considered discrete if it can be counted and is continuous if it can be measured. Someone can count students, tickets purchased and books, while one measures height, distance and temperature.
Qualitative data describes the qualities of data points and is non-numerical. It’s used to define the information and can also be further broken down into sub-categories through the four scales of measurement.
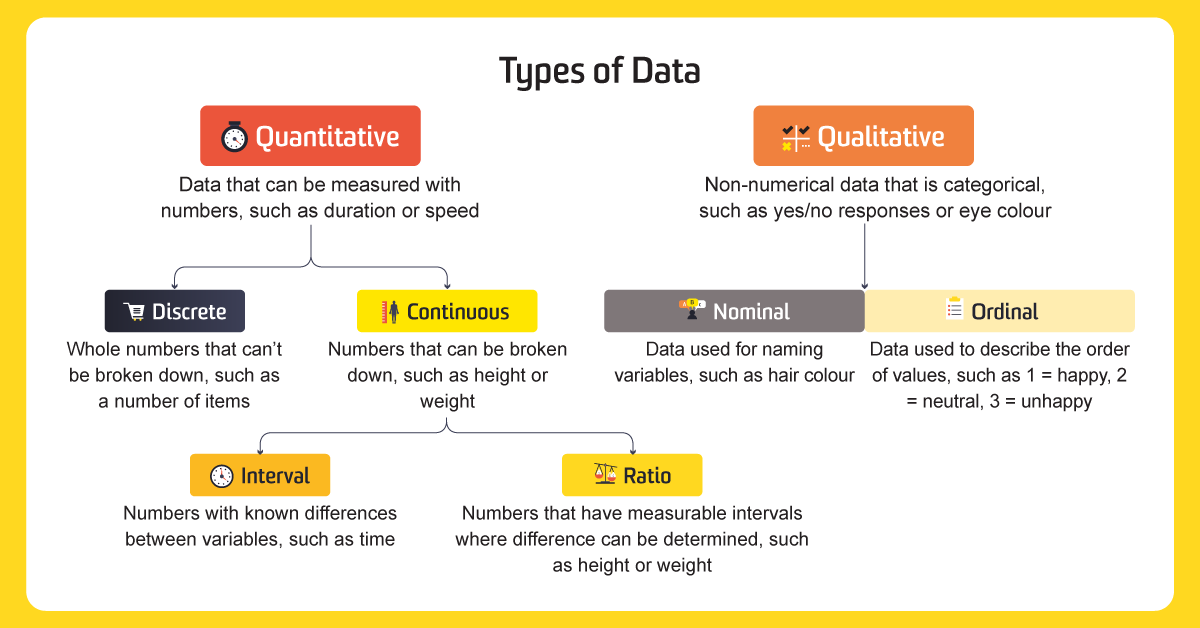
Scales of measurement is how variables are defined and categorised. Psychologist Stanley Stevens developed the four common scales of measurement: nominal, ordinal, interval and ratio. Each scale of measurement has properties that determine how to properly analyse the data. The properties evaluated are identity, magnitude, equal intervals and a minimum value of zero.
Identity: Identity refers to each value having a unique meaning.
Magnitude: Magnitude means that the values have an ordered relationship to one another, so there is a specific order to the variables.
Equal intervals: Equal intervals mean that data points along the scale are equal, so the difference between data points one and two will be the same as the difference between data points five and six.
A minimum value of zero: A minimum value of zero means the scale has a true zero point. Degrees, for example, can fall below zero and still have meaning. But if you weigh nothing, you don’t exist.