Activity 4 - Inferential Statistics Analysis Using SPSS
Completion requirements
Objective
Students will apply various inferential statistical methods using SPSS to test hypotheses based on provided survey data. They will conduct a normality test, correlation analysis, regression, t-test, ANOVA, and chi-square test using SPSS and interpret the results.Dataset
Instructions
Download the Dataset:
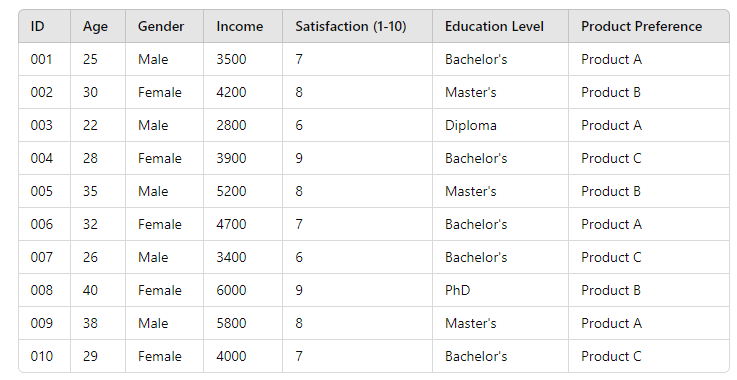
- Access the sample survey dataset from the link provided on Moodle.
- The dataset includes variables such as age, gender, income, satisfaction levels, and preferences.
Tasks:
- Normality Test: Conduct a normality test to assess whether the data for dependent variables follows a normal distribution. Use the appropriate SPSS feature and interpret the results.
- Correlation Analysis: Test the relationship between two continuous variables (e.g., Age and Satisfaction). Compute Pearson's r correlation coefficient using SPSS and interpret the strength and direction of the relationship.
- Regression Analysis: Perform a linear regression analysis to assess the relationship between an independent variable (e.g., Income) and a dependent variable (e.g., Satisfaction). Interpret which variables are significant and the nature of their impact.
- Independent t-test: Conduct an independent-samples t-test to compare the means of two groups (e.g., Gender and Satisfaction). Determine if there is a statistically significant difference between the groups.
- One-way ANOVA: Perform a one-way ANOVA to compare the means across three or more groups (e.g., Education level and Satisfaction). Interpret the results to determine if there is a significant difference between the groups.
- Chi-square Test: Run a chi-square test of independence to examine the relationship between two categorical variables (e.g., Gender and Preference). Interpret the result and determine if there is an association.
Submission:
Submit your SPSS output file (.spv) and a brief report (Word document or PDF) that includes:
- Hypotheses for each test.
- Screenshots or SPSS output for each analysis.
- Interpretation of the results (e.g., p-values, significance, effect sizes).
Grading Rubric:
- Normality Test (20%): Correct execution of the normality test and interpretation of results.
- Correlation Analysis (15%): Accurate calculation of Pearson's r and proper interpretation of the relationship between variables.
- Regression Analysis (20%): Correct execution of the regression analysis and interpretation of significant variables and impact.
- Independent t-test (15%): Proper execution of the t-test and interpretation of the mean differences.
- One-way ANOVA (15%): Correct performance of ANOVA and proper interpretation of differences between groups.
- Chi-square Test (15%): Correct application of the chi-square test and interpretation of the association between categorical variables.
- 30 September 2024, 4:52 PM